Using the GUI
Quick links
- On this page:
- Module Control
- Pin Control
- Automation Sequence
Getting Started
Get the GUI
- Install the Neuromodular GUI
- Launch Neuromodular
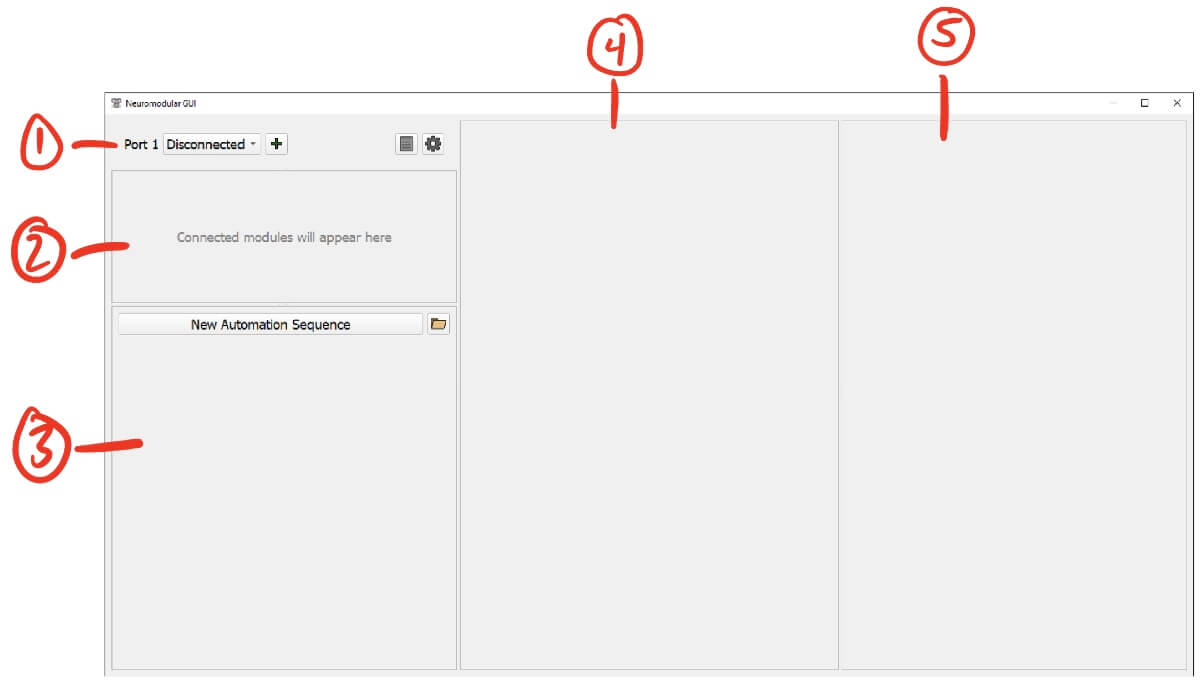
This is what the GUI looks like when you launch it:
Connecting a Module
- Plug the blue dev board into your computer
- Select the COM port corresponding to the blue dev board from the Port Manager dropdown
- Power on the module
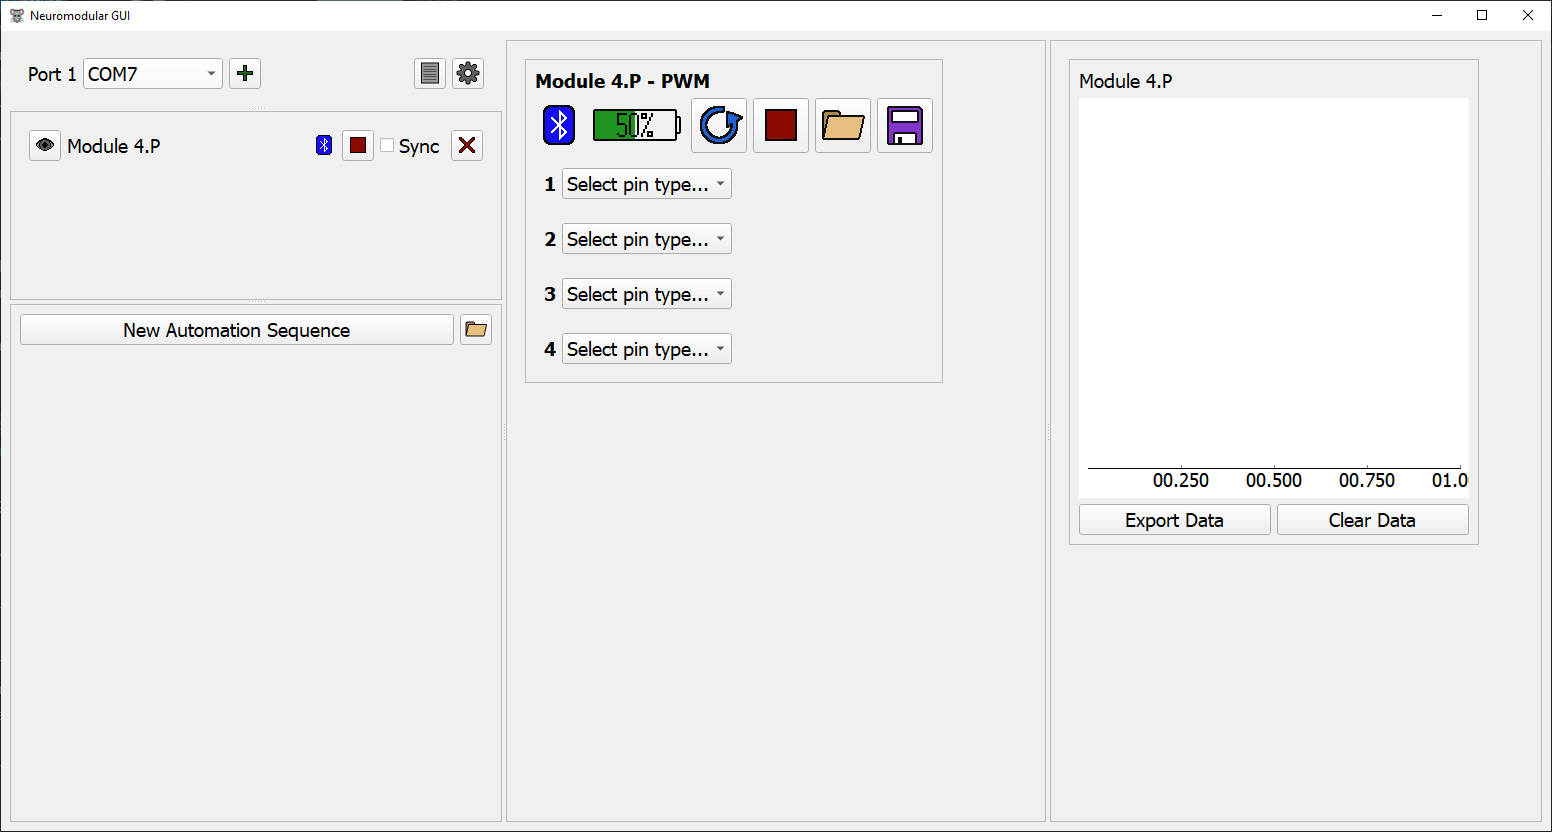
- The module should automatically show up like this:
Notes
- You can connect up to 16 modules per blue dev board. To increase this number, you can connect multiple blue dev boards at once.
Configuring the GUI
Port Manager
The port manager handles the connection between the GUI and serial devices connected to this computer. Access to the Logs window and Settings menu are found here.
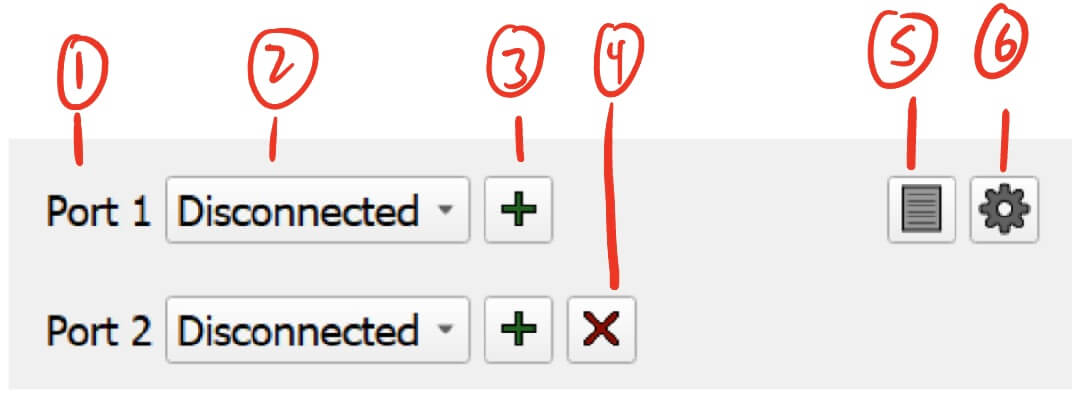
- Port number
- Port selection dropdown - Select the COM port for the connected serial device.
- This will refresh the list of connected devices whenever you click on the dropdown.
- To check that you are selecting the correct port for the blue dev board, you can do the following:
- Make sure the blue dev board is disconnected
- Click on the port dropdown and make note of the listed ports
- Plug the blue dev board into your computer
- Click on the port dropdown, and select the new COM port that appears
- Add port - Adds a new port.
- This can be used if you wish to connect another serial device. Examples of other devices include more blue dev boards or an Arduino microcontroller.
- Note that any device you connect will need a Baud Rate of 115200.
- Remove port - Removes this port.
- Show Logs - Opens the Logs window.
- Settings - Opens the Settings menu.
Logs
The Logs window displays messages sent to and received from connected serial devices.
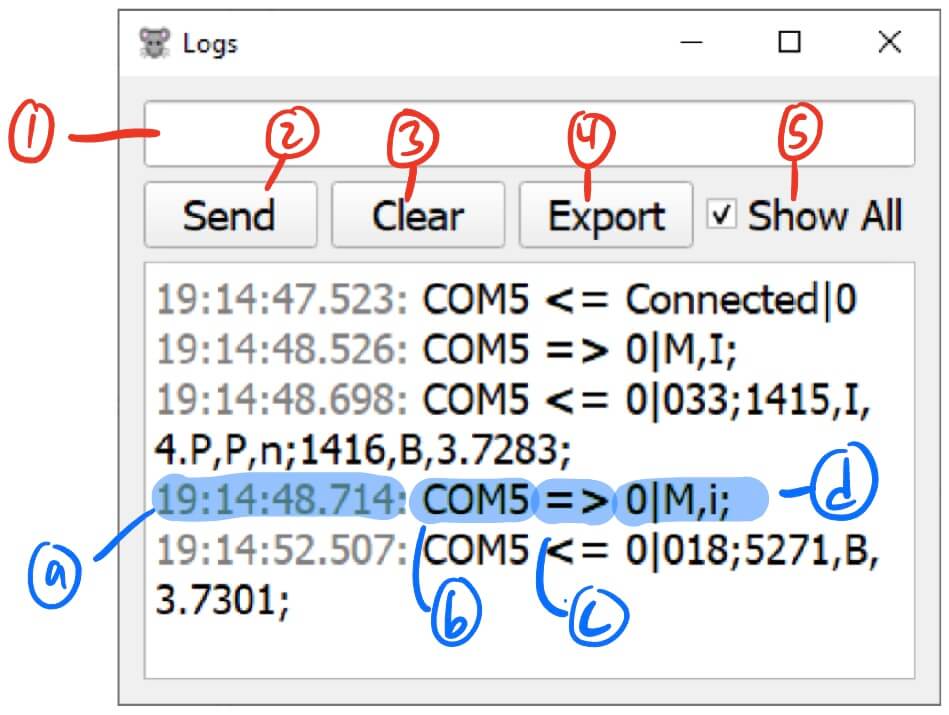
- Manual command entry - Allows for entry of manual commands to send to serial devices.
- Manual command send - Sends the entered manual command.
- Clear logs - Clears all of the recorded logs.
- Export logs - Exports the logs to a .csv file
- Show all logs - Enable to show all logs.
- By default, the logs window will only display errors. Enabling this will show all logs that come in from connected serial devices.
A serial message is broken down as follows:
- a. Timestamp of the message
- b. Serial port the message is to/from
- c. Direction of the message
=>- Message sent to serial device<=- Message received from serial device
- d. Message
Settings
The Settings menu contains application wide settings. Currently it only handles module graph display settings.
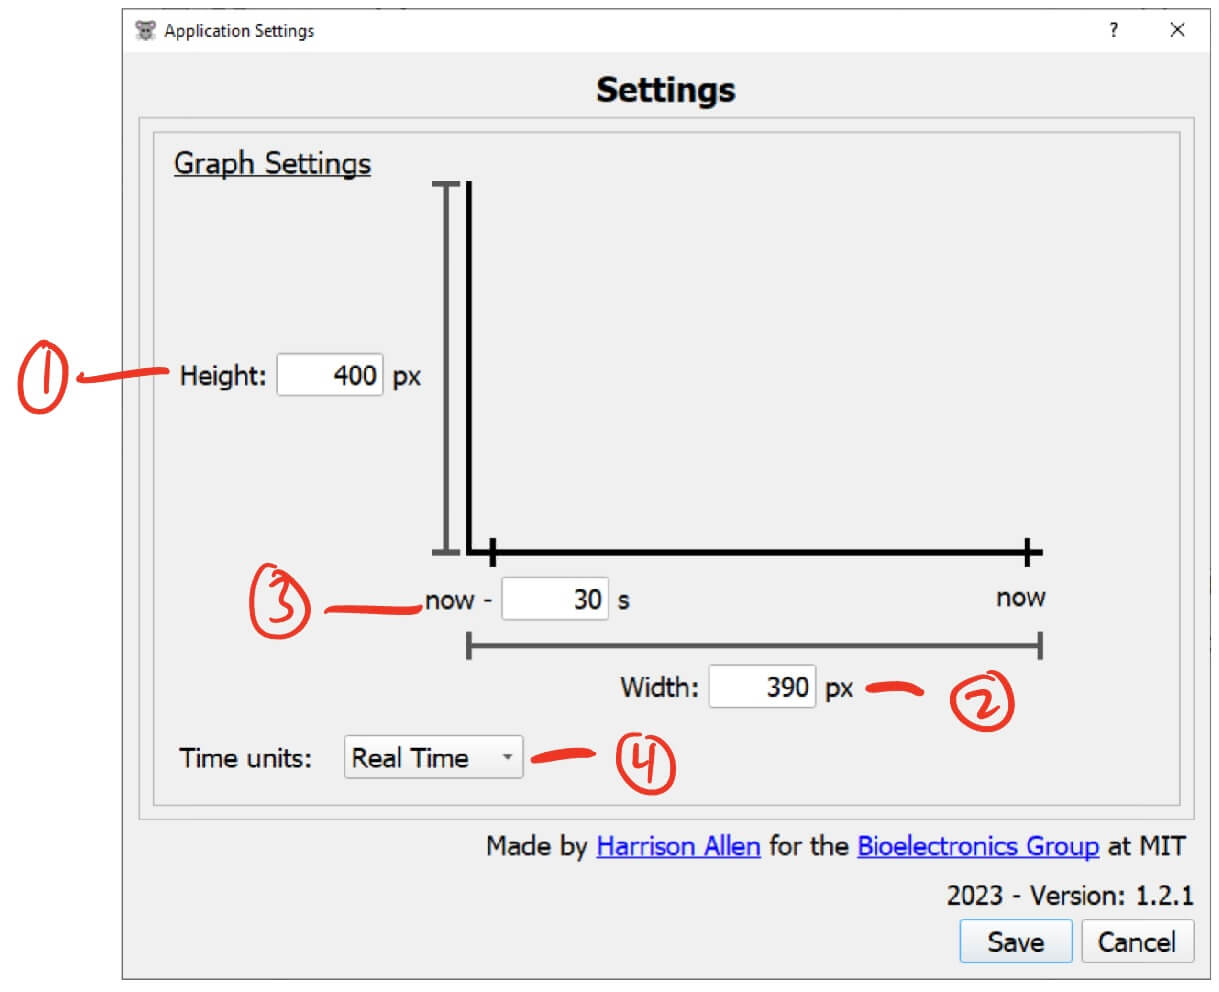
- Graph height - The height of the module graph, in pixels.
- Graph width - The width of the module graph, in pixels.
- Graph time range - How many seconds into the past to display on the graph.
- For example, to display all data from 30 seconds ago to now, you would set this value to 30.
- Graph time units - The units for the x axis of the graph.
- The availabe units are:
- Real Time - The time that the data point was recorded.
- Seconds - Seconds since the first data point was recorded.
- Milliseconds - Milliseconds since the first data point was recorded.
- The availabe units are: